Back to Projects
Statistical Analysis Using R Studio: Global Happiness and Socioeconomic Indicators
Coursework Project
Project Overview
This project employed R Studio's statistical computing capabilities to conduct an in-depth analysis of global happiness metrics in relation to various socioeconomic factors. Through rigorous data analysis, the project uncovered correlations and significant predictors of happiness, effectively translating complex statistical results into clear, practical insights.
Objectives
- Analyze the relationships between happiness scores and socioeconomic variables using extensive global datasets.
- Identify significant predictors of societal happiness using statistical techniques.
- Apply various statistical methodologies to validate and interpret findings.
- Convey complex analytical insights through clear visualizations and accessible summaries.
Methodology
A comprehensive analytical approach was taken using R Studio:
Data Collection and Preparation:
- Efficiently importing and cleaning extensive global datasets within R Studio.
- Ensuring data integrity and completeness prior to analysis.
Exploratory Data Analysis (EDA):
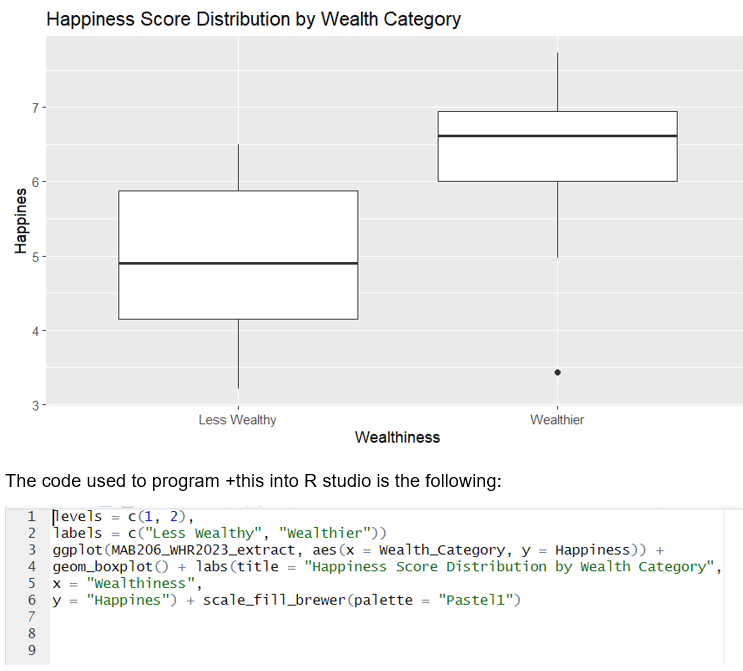
- Conducting preliminary analyses using descriptive statistics and visualization tools, such as histograms and box plots, to identify initial trends and outliers.
Statistical Testing and Modeling:
- Performing hypothesis tests (t-tests) to compare groups and validate relationships.
- Employing multiple linear regression analysis to identify and quantify the impact of various socioeconomic factors on happiness scores.
Interpretation and Communication:
- Translating statistical outputs into actionable insights and creating accessible visual summaries for broader audiences.
Key Findings and Results
- Statistical analysis revealed strong correlations between happiness and key socioeconomic variables such as GDP per capita, social support, and personal freedom.
- Multiple linear regression analysis indicated that approximately 74% of the variation in happiness scores globally could be explained by financial prosperity, community support networks, and individual liberties.
- The analysis demonstrated that higher socioeconomic development and personal freedoms were consistently associated with higher happiness scores globally.
Innovations and Insights
- Successfully leveraged advanced R Studio features to manage and analyze large datasets efficiently.
- Utilized robust statistical tests and regression analysis to uncover meaningful, quantifiable insights into the drivers of societal happiness.
- Enhanced the interpretability of complex statistical findings through clear visualizations, enabling effective communication of results.
Skills Applied
Statistical Analysis & Interpretation
Data Manipulation and Cleaning
Exploratory Data Analysis (EDA)
Hypothesis Testing
Multiple Linear Regression
Data Visualization
R Studio Programming